
AI data center energy costs in Europe range from €44M to €170M+ annually for a 100 MW campus depending on market, PUE, and contract structure. This guide covers electricity pricing by country, TCO breakdown, PPA strategy, grid fees, carbon exposure, and the efficiency architectures cutting costs in 2026.
Key Takeaway
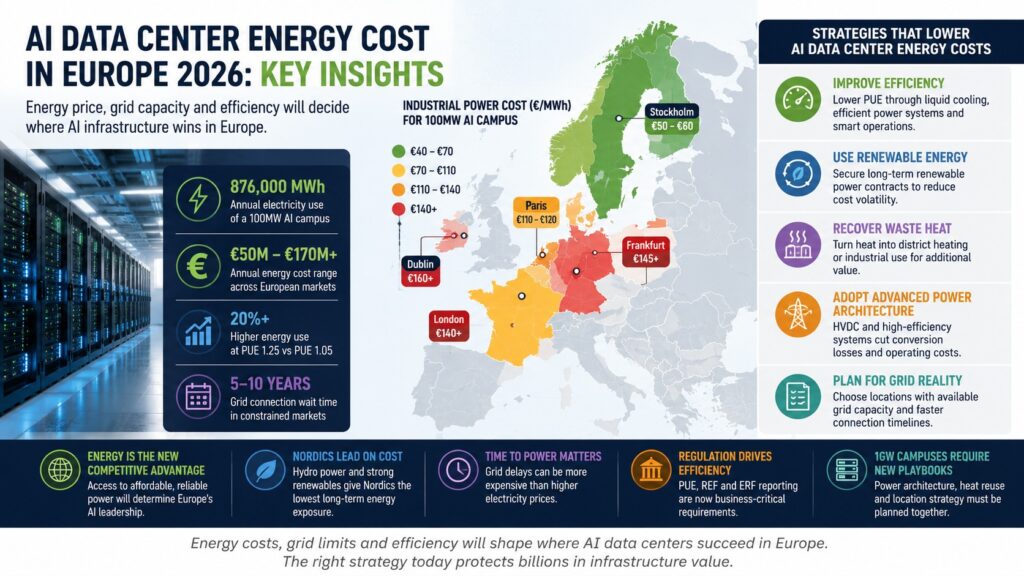
AI data center energy cost in Europe has become the defining infrastructure variable in 2026. A 100 MW AI campus consuming 876,000 MWh annually faces an electricity bill ranging from approximately €44M in Sweden to €149M in Dublin — before grid fees, demand charges, cooling overhead, and carbon exposure are added. The operators controlling costs are not simply choosing cheaper markets. They are combining efficient power architecture, Power Purchase Agreements, thermal reuse, and demand response to build a multi-layered cost structure that no single procurement decision can replicate.
Why AI Data Center Energy Cost Is Now Europe’s Defining Infrastructure Challenge
For the previous decade, European data center operators optimized around one question: where to build. Land availability, fiber connectivity, latency to financial centers, and tax incentives determined site selection.
In 2026, the primary question has changed. The question is now: where can we actually secure enough affordable power — and for how long?
Three structural forces arrived simultaneously to produce this shift.
Force 1: AI Rack Density Has Multiplied Power Consumption Per Square Meter
Traditional enterprise data centers were designed around 5–20 kW per rack. NVIDIA Blackwell GPU systems operate at 120–150 kW per rack — a 6–10× increase in power draw per unit of floor space. At this density, every percentage point of conversion loss or cooling inefficiency translates directly to millions of euros in annual operating cost.
A rack density shift of this magnitude was never anticipated in the design of European grid infrastructure, building electrical systems, or cooling plant. The result is that AI infrastructure does not just need more servers — it needs a fundamentally different energy architecture. For a full breakdown of how Blackwell hardware changes the power requirements picture, see our guide to Blackwell infrastructure deployments across Europe.
Force 2: Grid Infrastructure Cannot Scale at AI Speed
The FLAP-D markets — Frankfurt, London, Amsterdam, Paris, Dublin — dominated European digital infrastructure for a decade. Their grid connections were sized for cloud workloads at 20–50 MW per campus. AI deployments at 200–500 MW are requesting 4–10× the power from infrastructure built for a different era.
The result is visible in interconnection queues. High-voltage grid connections that previously took 6–12 months now take 4–7 years in Frankfurt and Dublin. Amsterdam has imposed effective development moratoriums. London faces substation capacity limits across multiple zones. The grid cannot be expanded fast enough to match AI deployment timelines.
Force 3: EU Regulation Has Made Efficiency a Legal Obligation
The EU Energy Efficiency Directive (EED) requires data centers above 500 kW to report PUE, Renewable Energy Factor (REF), and Energy Reuse Factor (ERF) annually. Germany’s Energieeffizienzgesetz (EnEfG) goes further, setting mandatory PUE targets for new facilities and requiring waste heat assessments for any site above 1 MW.
Facilities that cannot demonstrate efficient energy use face permit delays, restricted expansion rights, and potential compliance penalties. Energy efficiency has shifted from a sustainability aspiration to a legal operating requirement that directly affects the ability to build and scale.
For a detailed view of how these regulations intersect with the broader EU AI infrastructure strategy, see our EU sovereign AI infrastructure stack guide.
What “Industrial Electricity Price” Actually Means: The Full Cost Stack
The most common error in AI data center financial modeling is treating the industrial electricity price as the total energy cost. It is not. The electricity price is the starting point. The actual energy cost stack has seven components.
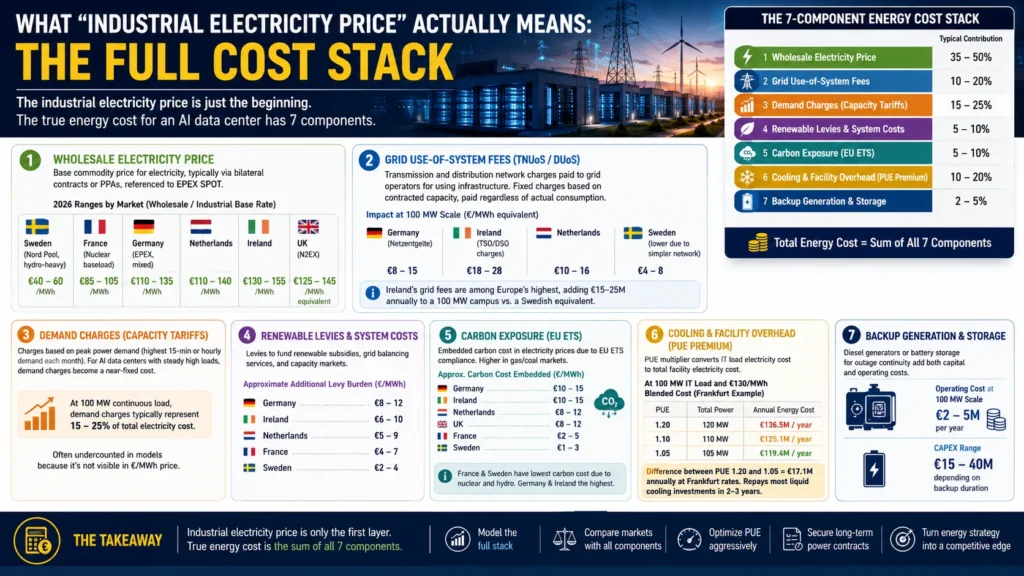
Component 1: Wholesale Electricity Price
The base commodity price, typically referenced against EPEX SPOT (European Power Exchange) day-ahead prices. For large industrial consumers, this is usually purchased through bilateral contracts or PPAs rather than day-ahead markets.
2026 ranges by market (wholesale/industrial base rate):
- Sweden (Nord Pool, hydro-heavy): €40–60/MWh
- France (nuclear baseload): €85–105/MWh
- Germany (EPEX, mixed): €110–135/MWh
- Netherlands: €115–140/MWh
- Ireland: €130–155/MWh
- UK (N2EX): €125–145/MWh equivalent
Component 2: Grid Use-of-System Fees (TNUoS / DUoS)
Transmission and distribution network charges paid to the grid operator for using the transmission and distribution infrastructure. These are fixed charges based on contracted capacity — paid regardless of actual consumption.
Impact at 100 MW scale:
- Germany (Netzentgelte): €8–15/MWh equivalent
- Ireland (TSO/DSO charges): €18–28/MWh equivalent
- Netherlands: €10–16/MWh equivalent
- Sweden: €4–8/MWh equivalent (lower due to simpler network topology)
Grid fees are one of the least-discussed but most significant cost differentials between European markets. Ireland’s grid fees are among Europe’s highest, adding €15–25M annually to a 100 MW campus operating cost versus a Swedish equivalent.
Component 3: Demand Charges (Capacity Tariffs)
Charges based on peak power demand rather than energy consumed — typically calculated on the highest 15-minute or hourly demand recorded each month. For AI facilities with continuous high-load GPU clusters, peak demand closely tracks average demand, making capacity tariffs a near-fixed cost.
At 100 MW continuous load, demand charges typically represent 15–25% of total electricity cost — a figure many financial models undercount because it does not appear in the €/MWh electricity price.
Component 4: Renewable Energy Levies and System Costs
Charges to fund renewable energy subsidies, grid balancing services, and capacity markets. Germany’s Erneuerbare-Energien-Gesetz (EEG) surcharge has been restructured but network cost socialization continues. UK’s Contracts for Difference levy recovery adds cost. Ireland’s PSO levy applies.
Approximate additional levy burden:
- Germany: €8–12/MWh
- Ireland: €6–10/MWh
- Netherlands: €5–9/MWh
- France: €4–7/MWh
- Sweden: €2–4/MWh (lower system cost socialization)
Component 5: Carbon Exposure (EU ETS)
Large energy consumers in EU markets face indirect carbon exposure through electricity prices that reflect generator EU ETS compliance costs. At current EU ETS prices of approximately €60–70/tonne CO₂ and average grid emission factors, this embeds €6–15/MWh of carbon cost into market electricity prices in gas-heavy markets.
France and Sweden have the lowest embedded carbon cost due to near-zero-carbon generation (nuclear and hydro respectively). Germany and Ireland have the highest due to continued gas and coal generation in the dispatch stack.
Direct carbon liability also arises from Scope 2 reporting under CSRD (Corporate Sustainability Reporting Directive) — requiring large EU companies to report and increasingly offset purchased electricity emissions.
Component 6: Cooling and Facility Overhead (PUE Premium)
The PUE multiplier converts IT load electricity cost to total facility electricity cost. A facility with PUE 1.20 consumes 20% more electricity than its IT load. A facility with PUE 1.05 consumes 5% more.
At 100 MW IT load and €130/MWh blended cost (Frankfurt example):
- PUE 1.20: 100 MW × 1.20 × 8,760 hrs × €0.130 = €136.5M/year
- PUE 1.10: 100 MW × 1.10 × 8,760 hrs × €0.130 = €125.1M/year
- PUE 1.05: 100 MW × 1.05 × 8,760 hrs × €0.130 = €119.4M/year
The difference between PUE 1.20 and PUE 1.05 at Frankfurt rates is €17.1M annually — a figure that repays most liquid cooling infrastructure investments within 2–3 years.
For a full treatment of how rack density and cooling architecture interact with total power requirements, see our complete AI data center power requirements analysis.
Component 7: Backup Generation and Storage
Diesel generators or battery storage for grid outage continuity add both capital cost and operating cost (fuel, maintenance, periodic testing load). At 100 MW scale, backup systems typically add €2–5M annually in operating cost, with CAPEX of €15–40M depending on backup duration requirements.
The Complete 2026 European AI Energy Cost Matrix
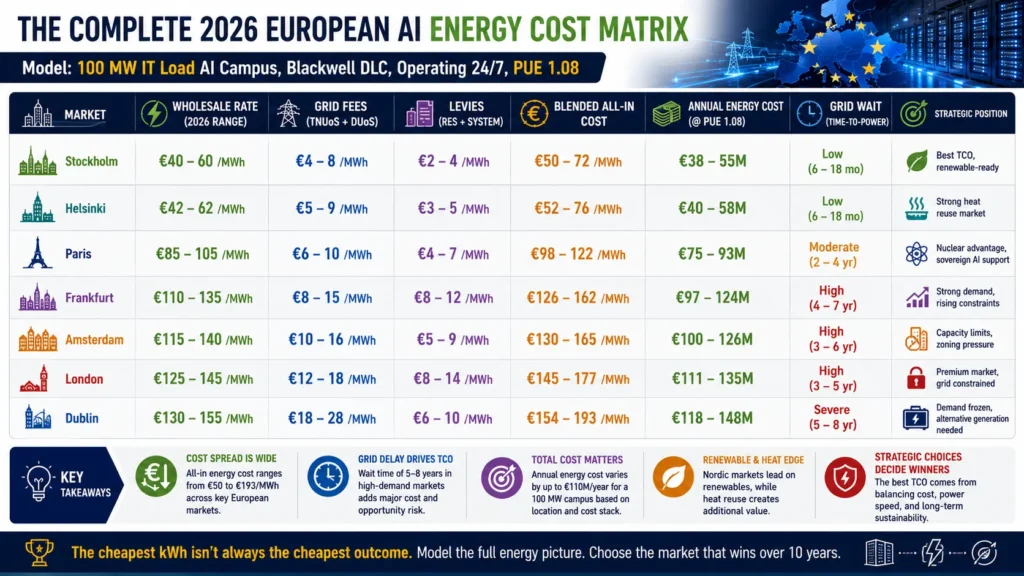
Model: 100 MW IT Load AI Campus, Blackwell DLC, Operating 24/7, PUE 1.08
| Market | Wholesale Rate | Grid Fees | Levies | Blended All-In | Annual Energy Cost | Grid Wait | Strategic Position |
|---|---|---|---|---|---|---|---|
| Stockholm | €40–60/MWh | €4–8 | €2–4 | €50–72/MWh | €38–55M | Low (6–18 mo) | Best TCO, renewable-ready |
| Helsinki | €42–62/MWh | €5–9 | €3–5 | €52–76/MWh | €40–58M | Low (6–18 mo) | Strong heat reuse market |
| Paris | €85–105/MWh | €6–10 | €4–7 | €98–122/MWh | €75–93M | Moderate (2–4 yr) | Nuclear advantage, sovereign AI support |
| Frankfurt | €110–135/MWh | €8–15 | €8–12 | €126–162/MWh | €97–124M | High (4–7 yr) | Strong demand, rising constraints |
| Amsterdam | €115–140/MWh | €10–16 | €5–9 | €130–165/MWh | €100–126M | High (3–6 yr) | Capacity limits, zoning pressure |
| London | €125–145/MWh | €12–18 | €8–14 | €145–177/MWh | €111–135M | High (3–5 yr) | Premium market, grid constrained |
| Dublin | €130–155/MWh | €18–28 | €6–10 | €154–193/MWh | €118–148M | Severe (5–8 yr) | Demand frozen, alternative generation needed |
The Stockholm-Dublin spread at 100 MW scale: €63–93M per year. This is not a marginal cost difference — it is a business model difference. A facility saving €70M annually in energy cost versus a Dublin equivalent can invest that saving in additional GPU capacity, faster depreciation, or lower pricing to customers.
For operators planning at gigawatt scale, these per-MW differences compound dramatically. Our 1GW data center power and infrastructure guide covers the full cost picture at that scale.
Power Purchase Agreements: How Serious Operators Actually Buy Energy
Most infrastructure coverage treats electricity price as a market rate. Sophisticated AI operators do not buy electricity at spot or standard industrial tariffs. They use Power Purchase Agreements (PPAs) — long-term bilateral contracts with generators that provide price certainty, renewable energy certification, and often sub-market rates.
PPA Structure for AI Data Centers
A corporate PPA for a large AI campus typically includes:
Volume commitment: The data center commits to purchasing a fixed volume of electricity (MWh/year) or a fixed capacity (MW) from a named generator — typically a wind farm or solar park. Volume commitments range from 50–100% of annual consumption.
Price structure: Fixed price per MWh for the contract term, or a fixed premium/discount to market index. Fixed-price PPAs provide full cost certainty; indexed PPAs provide partial protection with market upside.
Contract duration: 10–15 years is standard for new renewable projects, which need long-term revenue certainty to secure project financing. Shorter 5–7 year terms are available for existing projects at slightly higher prices.
Settlement mechanism: Physical delivery (power flows directly to the facility) or financial (virtual PPA — generator sells to market, data center buys from market, difference settled financially). Virtual PPAs are more common for large operators in markets where physical delivery is geographically constrained.
Renewable Energy Certificates (RECs/GOs): Guarantees of Origin are transferred to the data center, enabling Scope 2 market-based reporting of zero-carbon electricity consumption.
PPA Pricing vs Spot Market (2026)
In Nordic markets with abundant renewable capacity, PPAs for wind generation are being signed at €35–50/MWh fixed — below the current spot market average and providing 10-year price certainty. In Germany and the Netherlands, offshore wind PPAs command €65–85/MWh fixed due to higher project costs and grid connection premiums.
The PPA advantage for a 100 MW Frankfurt campus: purchasing 70% of consumption via a €75/MWh fixed PPA versus spot procurement at €130/MWh average saves approximately €38M annually on that portion of supply. Over a 10-year PPA term, that is €380M in avoided cost — before accounting for any spot price increases.
The True Cost of Grid Delay: Quantifying “Time-to-Power”
The draft introduced the concept of Time-to-Power without quantifying it. Here is the calculation that matters.
Scenario: 100 MW AI campus in Frankfurt, 5-year grid connection delay
During the 5-year delay, the operator has committed capital to land, permits, and partial construction but cannot operate GPUs. Revenue foregone during delay:
- Assumed revenue per MW of AI compute: €2.5–4M/year (based on GPU-as-a-service market rates for H100/B200 class hardware)
- Revenue foregone at 100 MW: €250–400M over 5 years
- Carrying cost on committed capital (site, partial construction, permits): €40–80M over 5 years at 6–8% cost of capital
- Total cost of a 5-year grid delay: €290–480M for a 100 MW project
This calculation reframes the site selection decision entirely. A Stockholm site with €70M higher annual energy cost but 18-month connection time versus a Frankfurt site with lower energy cost but 6-year connection time produces a better financial outcome over a 10-year horizon in virtually every scenario — because the Stockholm facility earns revenue for 4.5 additional years while Frankfurt is still waiting for power.
Time-to-Power is now a financial metric with calculable value, not an operational inconvenience.
The Full TCO Model: What a 100 MW AI Campus Actually Costs to Power
Infrastructure planning requires total cost of ownership, not just electricity price. Here is the complete 10-year energy TCO for a 100 MW AI campus in three representative markets.
Assumptions: 100 MW IT load, PUE 1.08 (DLC), 70% PPA coverage, 30% spot/grid, Blackwell infrastructure, no heat recovery revenue credited (shown separately).
| Cost Component | Stockholm (10yr) | Frankfurt (10yr) | Dublin (10yr) |
|---|---|---|---|
| Electricity — PPA (70%) | €190M | €420M | €480M |
| Electricity — Spot/Grid (30%) | €95M | €220M | €265M |
| Grid fees (TNUoS/DUoS) | €42M | €95M | €165M |
| Demand charges | €38M | €110M | €130M |
| Renewable levies | €20M | €85M | €65M |
| Backup generation OPEX | €25M | €30M | €35M |
| Cooling overhead (PUE premium) | €18M | €52M | €58M |
| Carbon/ETS exposure (Scope 2) | €5M | €45M | €50M |
| Total 10-year energy TCO | €433M | €1,057M | €1,248M |
| Annual average | €43M | €106M | €125M |
The 10-year TCO difference between Stockholm and Dublin is €815M for a single 100 MW campus. That gap funds approximately 5,800 additional NVIDIA B200 GPUs — or the entire hardware buildout of a mid-scale AI research cluster.
PUE as a Financial Instrument: The Efficiency Cost Lever
Power Usage Effectiveness is typically discussed as a sustainability metric. At European electricity prices, it is a financial instrument with direct P&L impact.
The PUE arithmetic at Frankfurt rates (€130/MWh blended all-in):
| PUE | Annual Facility Energy | Annual Cost | vs PUE 1.20 |
|---|---|---|---|
| 1.20 | 1,051,200 MWh | €136.7M | Baseline |
| 1.15 | 1,007,400 MWh | €130.9M | -€5.7M/yr |
| 1.10 | 963,600 MWh | €125.3M | -€11.5M/yr |
| 1.08 | 944,640 MWh | €122.8M | -€13.9M/yr |
| 1.05 | 919,800 MWh | €119.6M | -€17.2M/yr |
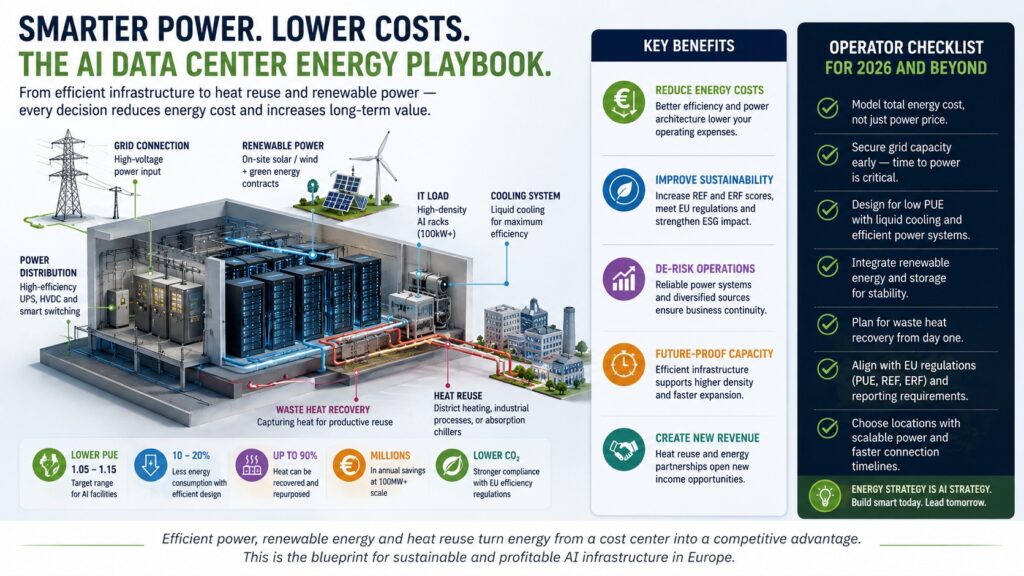
Moving from PUE 1.20 (a well-optimized air-cooled facility) to PUE 1.08 (a liquid-cooled AI facility) saves €13.9M annually at Frankfurt rates. The direct liquid cooling infrastructure enabling that PUE improvement costs approximately €15–25M in CAPEX — a payback period of 1–2 years.
This is why liquid cooling is not an efficiency choice for AI infrastructure. It is a financial obligation. For a comprehensive look at how power architecture decisions interact with PUE at different rack densities, see our AI data center power requirements guide for 2026.
HVDC Architecture: Where It Saves Money and Where It Does Not
High-Voltage Direct Current (HVDC) power distribution reduces AC conversion losses from 8–15% to 1–3%, which at European electricity prices produces measurable operating cost reduction. But the savings are density-dependent, and deploying HVDC in the wrong context is an expensive mistake.
Where HVDC saves real money (Frankfurt example, 100 MW facility):
- Traditional AC system efficiency: 90% (10% conversion loss)
- HVDC system efficiency: 98% (2% conversion loss)
- Efficiency delta: 8 percentage points
- Power saved: 8 MW of continuous demand
- Annual energy saving: 8 MW × 8,760 hrs = 70,080 MWh
- At €130/MWh: €9.1M annual saving
- HVDC infrastructure premium vs AC: approximately €18–25M
- Payback period: 2.0–2.7 years
Where HVDC does not save enough to justify the premium:
Below 40 kW per rack, the conversion loss advantage shrinks and the 15–25% HVDC CAPEX premium takes 8–12 years to recover. For mixed-workload colocation facilities with average rack density below 40 kW, optimized AC with modern UPS is more cost-effective.
The HVDC value proposition is specific to AI-dense deployments operating above 80 kW per rack continuously. That describes every Blackwell deployment — but does not describe general-purpose enterprise infrastructure. Our detailed analysis of HVDC data centers in Europe covers the full architecture decision framework.
Thermal Reuse: Turning the Energy Bill Into a Revenue Offset
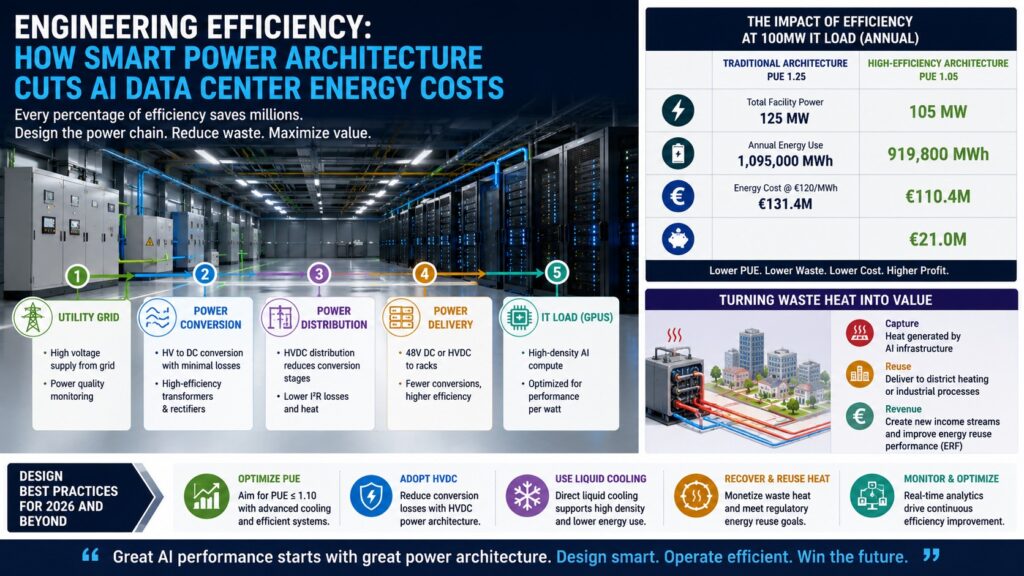
Every watt consumed by an AI GPU eventually becomes heat. At 100 MW scale with direct liquid cooling, that heat exits the system at 55°C–65°C — directly injectable into 4th Generation District Heating (4GDH) networks without industrial heat pumps.
The financial impact is substantial enough to change the energy cost calculus for facilities near municipal heating networks.
Revenue offset calculation (Frankfurt, 100 MW campus):
- Recoverable heat: approximately 78 MW (accounting for thermal losses)
- Annual export (0.70 seasonal utilization): 78 MW × 8,760 hrs × 0.70 = 477,288 MWh
- Frankfurt HPA price: €30–36/MWh
- Direct heat revenue: €14.3M–€17.2M annually
- Cooling OPEX reduction (eliminated cooling towers): €5.5M
- Carbon offset credit (replacing gas heating): €5.2M
- Total annual value: €25–28M
Applied against a Frankfurt annual energy cost of €97–124M, district heating revenue reduces effective net energy cost to approximately €69–99M — compressing the Frankfurt vs Stockholm gap significantly.
For operators within 2 km of a 4GDH network, district heating is not a sustainability feature. It is a cost management strategy. Our complete guide to district heating AI data center waste heat recovery covers the full economics, city-by-city heat purchase agreement pricing, and seasonal demand management.
Market Deep Dives: The Six Most Important European Markets
Germany (Frankfurt / Munich)
Germany combines Europe’s most important enterprise digital hub with some of its most challenging energy economics. Frankfurt remains indispensable for financial services latency and enterprise connectivity — but the energy cost premium over Nordic alternatives runs €50–70M annually for a 100 MW campus.
The German-specific cost driver most often missed: Netzentgelte (network fees) vary significantly by grid region and can range from €8–18/MWh equivalent depending on connection point. Facilities connecting at higher voltage levels (110 kV vs 20 kV) pay materially lower distribution fees — a design decision worth €5–10M annually at 100 MW scale.
Germany’s EnEfG mandate for PUE ≤ 1.2 for new data centers above 1 MW is now enforced with reporting obligations. Facilities above 1 MW must also submit waste heat feasibility assessments, and those within 2 km of 4GDH infrastructure face regulatory pressure to connect.
Ireland (Dublin)
Dublin’s energy situation has deteriorated more severely than most infrastructure models assume. EirGrid has implemented capacity restrictions that effectively prevent new large-scale grid connections in the Dublin metropolitan area. Projects requiring above 30 MW of new capacity face multi-year queues even for technical feasibility assessments — before the actual connection timeline begins.
The practical implication: Dublin is no longer a viable location for new AI campuses above 50 MW unless the operator has a credible behind-the-meter generation strategy (on-site gas, emerging SMR pipeline, or co-located renewable) that bypasses grid dependency. Ireland’s electricity prices — among Europe’s highest at €130–155/MWh wholesale — combined with severe grid constraints make Dublin the highest-risk major market in Europe for AI infrastructure planning.
France (Paris / Lyon / Brittany)
France’s nuclear generation fleet produces electricity at some of Europe’s lowest carbon intensity and among its most competitive industrial rates at €85–105/MWh wholesale. EDF’s industrial tariffs, particularly the ARENH mechanism (though subject to ongoing revision), provide large consumers with access to below-market nuclear output.
France’s additional advantage in 2026 is the Plan France 2030 AI infrastructure program, which provides preferential grid access and co-investment for AI campuses that meet sovereignty and efficiency criteria. Facilities qualifying under Plan France 2030 can access grid connections with 18–30 month timelines versus the standard 3–5 year queue.
The risk: France’s nuclear fleet reliability depends on EDF’s maintenance schedule, which has been variable. Operators should model both EDF baseload pricing and spot market exposure for periods when nuclear output is reduced.
Netherlands (Amsterdam)
Amsterdam’s grid situation mirrors Dublin’s trajectory but 2–3 years behind. Liander (the regional grid operator) has issued formal capacity warnings for the Amsterdam metropolitan area, and new large-scale connections are subject to extended waiting periods and feasibility reviews. The 2023 zoning moratorium on new hyperscale development in North Holland province has shifted attention to alternative Dutch locations including Rotterdam and Eindhoven.
Dutch electricity prices (€115–140/MWh wholesale) and grid fee structure produce a blended all-in cost of €130–165/MWh — making the Netherlands the most expensive large market after Ireland for new AI deployments without an alternative energy strategy.
Nordic Markets (Sweden / Finland / Denmark)
The Nordic markets present the strongest financial case for AI infrastructure in Europe in 2026. Sweden’s combination of hydroelectric baseload and expanding wind generation produces spot prices of €40–60/MWh with low volatility. Finland’s market is closely coupled to Sweden via the Nord Pool exchange and offers similar pricing.
The Nordic operational advantages compound: cooler climate enables higher free-cooling utilization (lower cooling OPEX), mature 4GDH networks in Stockholm, Helsinki, and Copenhagen create heat revenue opportunities worth €12–18M annually for a 100 MW campus, and grid connection timelines run 6–18 months versus years in FLAP-D markets.
The limitation: talent density and enterprise customer proximity are lower than FLAP-D markets. For AI training workloads where latency to end users is irrelevant, Nordic siting is strongly favored. For inference serving requiring low latency to European end users, a Nordic training hub plus FLAP-D inference edge architecture may be optimal.
Application Layer Efficiency: The Cost Variable That Infrastructure Guides Miss
Most AI data center energy cost analyses focus entirely on facility infrastructure. The most significant overlooked variable is application-layer compute efficiency — how many useful outputs a given workload produces per unit of energy consumed.
Two 100 MW AI facilities with identical hardware, identical PUE, and identical electricity contracts can have radically different effective energy costs per AI output if their workloads differ in inference efficiency.
Organizations running enterprise AI applications should evaluate the compute intensity of their chosen platforms before finalizing infrastructure requirements. The choice between enterprise AI knowledge management systems — which vary significantly in their underlying model sizes and inference compute requirements — directly determines sustained rack utilization and therefore effective energy cost per unit of business output.
Similarly, the architectural choice between enterprise AI search and RAG-based systems produces different inference load profiles. RAG architectures with smaller retrieval models can serve equivalent quality outputs at 40–60% of the compute cost of pure LLM inference — a difference that, at data center scale, represents tens of megawatts of demand.
For enterprise operators comparing specific platforms, our analysis of Guru versus Glean as enterprise AI knowledge tools includes a compute efficiency comparison that translates directly to infrastructure cost implications.
Energy Hedging and Risk Management: Protecting the Energy Budget
AI data center energy costs are not static. Electricity markets in Europe have demonstrated price volatility of 200–400% over 12-month periods during supply shocks (the 2022 gas crisis produced spot prices exceeding €600/MWh in some European markets). Operators without structured hedging programs face P&L exposure that can render otherwise well-designed facilities financially unviable.
The three-layer hedging framework used by sophisticated operators:
Layer 1 — Long-term PPAs (60–80% of consumption): Fixed-price renewable PPAs with 10–15 year terms cover the majority of baseload consumption with full price certainty. The trade-off is volume commitment risk — if the facility operates below committed PPA volume, the operator pays for power not consumed.
Layer 2 — Medium-term bilateral contracts (15–25% of consumption): 1–3 year fixed-price contracts with utilities or energy traders cover the portion of consumption not locked in PPAs. These provide flexibility to adjust coverage as the facility’s load profile develops.
Layer 3 — Short-term market exposure (5–15% of consumption): A small portion of supply left on day-ahead or spot markets provides operational flexibility for demand response participation and allows operators to benefit from occasional low-price periods.
Demand response as a revenue layer: Facilities with on-site battery storage or flexible inference workloads can participate in European capacity markets and demand response programs, earning €8–25/MWh equivalent in capacity payments. At 100 MW with 15% flexible load, this generates approximately €1.5–4M annually — partially offsetting grid fee costs.
The Contrarian Case: Cheap Energy Markets Are Not Always Cheaper
The straightforward financial case for Nordic AI infrastructure — lowest energy cost, fastest grid access, heat revenue — is correct as a starting point but incomplete as a decision framework.
Three factors can erode the Nordic cost advantage for specific operator profiles:
Talent cost premium: Stockholm and Helsinki have competitive but high-cost technical labor markets. For facilities requiring large on-site operations teams, the salary differential versus Frankfurt or Amsterdam may offset €5–15M annually of energy savings for large teams.
Latency penalty for inference workloads: A 100 MW training cluster in northern Sweden operates effectively at any distance from users. A 100 MW inference serving cluster serving Frankfurt financial services customers needs latency below 5–10ms — physically incompatible with Stockholm siting. Inference-focused operators cannot simply arbitrage Nordic energy prices without accepting latency penalties.
PPA volume risk in low-demand Nordic markets: Nordic renewable PPAs are priced attractively but require volume commitments. Facilities that ramp slowly or operate below committed PPA volumes face penalty payments that erode projected savings. Projects with uncertain ramp timelines should model PPA volume risk explicitly before committing to long-term Nordic contracts.
The correct conclusion: Nordic markets are optimal for AI training workloads at scale with predictable utilization. For inference workloads, a hybrid architecture — training in the Nordics, inference edges in FLAP-D markets — captures energy cost savings where workload characteristics allow, while maintaining latency performance where it is required.
How to Choose the Right European Market: Decision Framework
Choose Nordic markets (Sweden / Finland) if:
- Your workload is AI training or batch inference where latency to users is not critical
- You are deploying at 100 MW+ where the energy cost differential dominates other factors
- You have 10+ year planning horizon and can secure long-term PPAs
- Heat revenue from 4GDH integration is part of your financial model
Choose France if:
- You need competitive energy pricing closer to major Western European user populations
- Your project qualifies for Plan France 2030 preferential grid access
- Carbon intensity of electricity supply is a material reporting or ESG obligation
- Sovereign AI program alignment provides non-energy benefits (funding, regulatory certainty)
Choose Germany / Netherlands for:
- Enterprise customers with latency requirements to Frankfurt or Amsterdam financial infrastructure
- Colocation facilities where customer proximity justifies the energy premium
- Projects where existing grid contracts or campus expansion avoids new connection queues
- Workloads where latency to EU enterprise users is commercially critical
Avoid or approach with extreme caution:
- Dublin for any new deployment above 50 MW without behind-the-meter generation strategy
- Any market where grid connection timeline exceeds your revenue break-even horizon
- Markets where PPA counterparties cannot be identified — spot exposure at European prices destroys AI infrastructure economics
FAQ
1.What is the average AI data center energy cost in Europe in 2026?
Ans-The all-in annual energy cost for a 100 MW AI campus ranges from approximately €38–55M in Nordic markets (Sweden, Finland) to €118–148M in Dublin, depending on electricity rate, grid fees, demand charges, and PUE. The most common planning error is using only the wholesale electricity price rather than the fully-loaded cost including grid use-of-system fees (€4–28/MWh depending on market), demand charges (15–25% of electricity cost), renewable levies, and cooling overhead from the PUE multiplier. The difference between a Nordic and an Irish total energy cost for the same 100 MW facility over 10 years exceeds €800M.
2.Why are AI data centers paying more for electricity than cloud facilities did?
Ans-Two reasons. First, AI GPU clusters at 100–150 kW per rack operate at continuous maximum load — there is no idle period during which power draw drops. Cloud workloads had natural utilization cycles that reduced average draw. Second, AI facilities require larger grid connections than equivalent cloud campuses (10× the power per unit of floor space), which exposes them to higher demand charges and grid capacity fees proportional to their contracted capacity rather than actual consumption.
3.What is a Power Purchase Agreement and why do AI operators use them?
Ans-A PPA is a long-term bilateral contract (typically 10–15 years) between a data center and a renewable energy generator, fixing the price per MWh for a committed volume of electricity. AI operators use PPAs to eliminate electricity price volatility risk, secure below-market rates for renewable capacity, and obtain Guarantees of Origin for Scope 2 carbon reporting. In Nordic markets, wind PPAs are available at €35–50/MWh fixed — 20–30% below current spot market averages. Over a 10-year PPA, a Frankfurt operator purchasing 70% of a 100 MW facility’s consumption via PPA versus spot market saves approximately €350–420M in energy cost.
4.Why is Ireland becoming a difficult market for new AI data centers?
Ans-EirGrid has imposed effective capacity restrictions on large new grid connections in the Dublin metropolitan area, with multi-year queues for projects above 30 MW. Combined with Ireland’s electricity prices (€130–155/MWh wholesale, among Europe’s highest), the Irish market offers the worst combination of cost and access for new large-scale AI deployments. Existing operators with established grid contracts are not affected, but new entrants above 50 MW face a market where the power question may not be answerable on any viable financial timeline without behind-the-meter generation.
5.How does PUE affect the total energy cost at European electricity prices?
Ans-At Frankfurt’s blended all-in rate of approximately €130/MWh, the difference between PUE 1.20 and PUE 1.05 for a 100 MW facility is approximately €17M annually. The capital cost of liquid cooling infrastructure enabling PUE improvement from 1.20 to 1.08 is typically €15–25M — a payback period of 1–2 years at Frankfurt rates. At Stockholm’s €55/MWh blended rate, the same PUE improvement saves approximately €7M annually with a 2–4-year payback. PUE improvement is financially obligatory at European AI scale — the question is only which market produces the fastest payback on the cooling capital.
6.Can waste heat recovery meaningfully reduce net energy costs for European AI facilities?
Ans-Yes, at facilities within 2–3 km of a 4GDH network. A 100 MW campus near Frankfurt can recover approximately 78 MW of waste heat and sell it into the Mainova district network at €30–36/MWh, generating €14–17M in direct heat revenue plus €5–6M in cooling OPEX reduction and €4–6M in carbon offset value. Total annual value of €23–29M reduces effective net energy cost from €97–124M to approximately €68–101M — a 25–30% reduction in effective energy burden. For full economics and city-by-city HPA pricing, see our district heating AI data center guide.
7.What is the financial cost of a grid connection delay?
Ans-A 5-year grid connection delay for a 100 MW AI campus costs approximately €290–480M in foregone revenue and capital carrying costs. At GPU-as-a-service market rates of €2.5–4M per MW annually, 100 MW of delayed capacity represents €250–400M in missed revenue over 5 years. Add €40–80M in carrying cost on committed site, permits, and partial construction capital. This calculation makes Time-to-Power a financial metric with direct ROI implications — a Stockholm site with €70M higher annual energy cost but 18-month connection time outperforms a Frankfurt equivalent with 6-year connection delay in nearly every 10-year financial model.
Conclusion: Europe’s AI Race Is an Energy Strategy Race
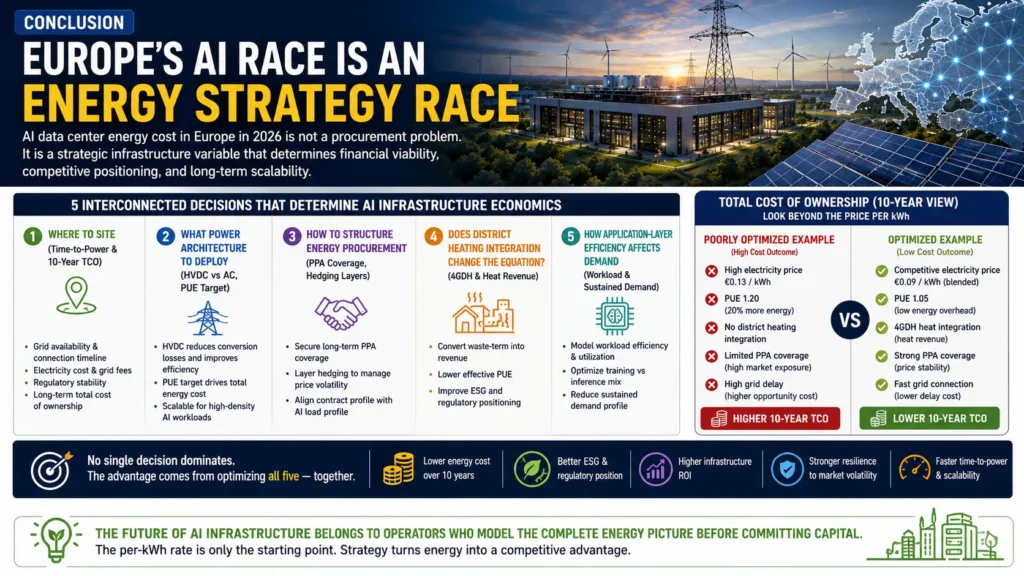
AI data center energy cost in Europe in 2026 is not a procurement problem. It is a strategic infrastructure variable that determines financial viability, competitive positioning, and long-term scalability for every operator building at meaningful scale.
The operators who will control AI infrastructure economics across Europe over the next decade are making five interconnected decisions right now: which market to site in (Time-to-Power and 10-year TCO), what power architecture to deploy (HVDC vs AC, PUE target), how to structure energy procurement (PPA coverage, hedging layers), whether district heating integration changes the net cost equation, and how application-layer efficiency affects the sustained demand profile.
No single decision dominates. A Stockholm site with a poorly structured PPA, PUE 1.20, and no heat recovery may cost more per unit of AI output than a Frankfurt facility with PPA coverage, PUE 1.05, and a 4GDH heat contract. The market that looks cheapest on a per-kWh basis may cost more when the full TCO — including grid delay, demand charges, carbon exposure, and foregone heat revenue — is calculated over 10 years.
The future of AI infrastructure belongs to operators who model the complete energy picture before committing capital. The per-kWh rate is only the starting point.
Disclaimer & Transparency Note
Transparency Note: Research & Methodology This comprehensive market guide is the result of deep data modeling of the European AI infrastructure and energy landscape for 2026. The financial models, industrial tariff structures (€/MWh), grid utilization penalties, and regional Transmission System Operator (TSO) lead times are synthesized from real-world non-household energy data, European regulatory frameworks (including the EU Energy Efficiency Directive and Germany’s EnEfG), and hardware thermal design profiles of NVIDIA Blackwell-generation architectures operating at 120–150 kW per rack. All total cost of ownership (TCO) models assume a 100 MW IT load running continuous frontier model training workloads (24/7/365) and are benchmarked against current regional PPA availability and wholesale marginal pricing trends.
Technical & Financial Disclaimer The analysis, calculations, and regional data points provided in this guide are intended strictly for editorial, educational, and strategic planning purposes and do not constitute formal engineering, financial, tax, or legal advice. Because industrial energy structures, network cost socialization, and grid connection parameters are highly localized and subject to rapid contractual and regulatory shifts, infrastructure decisions—particularly those regarding site selection, Power Purchase Agreements (PPAs), and multi-megawatt substation allocations—require independent validation by certified professional engineers, energy brokers, and legal counsel.
Market Volatility & Regional Risk Warning While the financial projections mapped across the FLAP-D and Nordic markets are grounded in early 2026 wholesale indicators, European energy markets remain subject to structural price volatility, geopolitical supply shocks, and evolving regulatory mandates (such as the upcoming EU Data Centre Energy Efficiency Package). “Time-to-Power” metrics, localized grid fee structures (TNUoS/DUoS), and municipal heat purchase agreement (HPA) pricing can fluctuate significantly based on micro-geography, specific pipeline proximity, and changing utility parameters. Operators must execute site-specific feasibility assessments prior to committing capital or entering long-term utility queues.
Author –Saameer is a technology journalist and infrastructure analyst covering AI systems, data center architecture, energy infrastructure, and European digital policy. His work focuses on the gap between AI infrastructure promises and real-world enterprise deployment economics.